The Google Charts API
Google
has released a new charting API. The API generates all sorts of
dynamic charts. The charts are completely parameterized in the
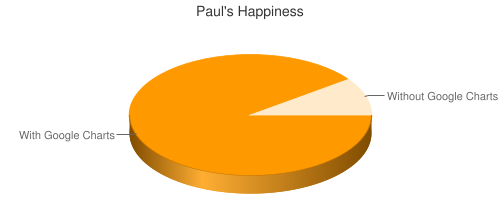
URL. My happiness pie chart shown above was generated with:
http://chart.apis.google.com/chart?cht=p3&chd=t:90,10&chs=500x200
&chl=With+Google+Charts|Without+Google+Charts
&chtt=Paul's+Happiness
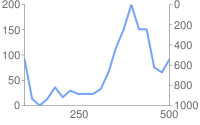
There are lots of chart types: lines, bars, pies, Venn diagrams, scatter plots. The URL syntax is very straightforward. It is like being able to embed gnuplot in your blog. I'm surprised at the power of this little language. Some more examples:


Documentation and many more examples are at the Google Chart API site